8. Monitoring
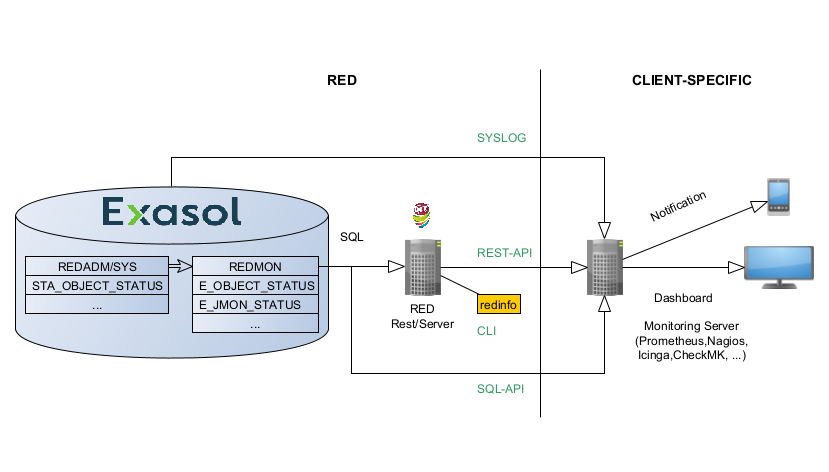
Fig. 8.1 Monitoring Overview
RED exposes monitoring data through four dedicated interfaces.
REST API
Provides a dedicated set of APIs for monitoring. Including RED and Exasol Database status data.SQL API
Allows access to all control and status views within the database.syslog
Expose the Exasol syslog information. Refer to the Exasol homepage for more information on monitoring.CLI
Redinfo is a commandline tool on the RED Batch enviroment providing status information.
RED provides all control and status information in views and tables in the database. Even the status of the RED-PSS can be monitored in this way using SQL-queries only. Therefore, it is not strictly necessary to monitor individual processes on OS-level. Detailed documentation of individual columns in the referenced tables and views can be found directly in the database itself as column comments.
8.1. RED REST Monitoring Endpoints
The APIs are accessable via swagger (Open API) and can be
found under //http[s]:<red-server>:<rest-port>/docs.
8.1.1. Authentication
Authentication is done via Access Token provided in each request. The User must be provisioned in the RED Framework first see REST API.
8.1.2. Monitoring Endpointlist
Endpoint |
Description |
|---|---|
/mon/adm_jmon_current_load |
Returns current number of active processes in the default queue (job and watcher processes with short runtime), the loader queue (long running processes that execute the load) and the action queue. As well the configured queue size and the queue utilizations. |
/mon/adm_jmon_job_status |
Job Name, Job ID, Execution Time, Next execution Time of the latest job executions that were started by job monitor (jmon) process within all schemas. |
/mon/all_adm_job_status |
Job execution status information. Error and alert levels depend on execution return codes and statistical calculations of run time deviations. See comment on column ALERT for more information. Alert level. 0 = no alert, 1 = warning, 2 = error. 1 means either execution has been delayed between 30 and 60 seconds after next scheduled start time or run time took 3-4 standard deviations longer than average run time. 2 means either an error occurred or execution has been delayed for more than 60 seconds after next scheduled start or run time took more than 4 standard deviations longer than average run time. |
/mon/all_adm_watcher_exec_status |
Error log of watcher processes within all schemas including alert evaluation for execution retries. |
/mon/all_adm_watcher_status |
Alert evaluation of watcher processes within all schemas (REDADM, CFIADM, DBIADM, ZDWADM) for the last processing. |
/mon/all_db_size_last_day |
Returns raw size, memory size, object count, storage use every 30 minutes. |
/mon/all_monitor_last_day |
Returns cpu utilization, hdd read ratios, net traffic ratios, swap ratio, … information every 30 seconds. |
/mon/all_usage_last_day |
Returns number of login users and queries every second |
/mon/app_status |
Applications in alert state. Returns Schema, Table name, min and max bdate, effected number of days and alert code and alert reason. |
/mon/check_python_vm |
Python VM Availability and Latency Check |
/mon/db_backup_list |
Returns a list of useable backups. |
/mon/jmon_status |
Log data of the latest job executions that were started by job monitor (jmon) process within all schemas. |
/mon/object_status |
Objects in alert state. Returns Schema, Table name, min and max bdate, effected number of days and alert code and alert reason. |
/mon/exa_dba_transaction_conflicts_last_day |
Returns for each minute the number of transaction conflicts and max transactionconflict duration in seconds |
/mon/exa_loadavg |
Returns information on the current CPU load in each of the EXASolution nodes. |
/mon/exa_statistics_object_sizes |
Returns the sizes of all statistical system tables aggregated by the type of the statistical info. |
/mon/exa_volume_usage |
Returns details of the database usage of the storage volumes. |
8.2. SQL API/Monitoring Views
Database objects whose name begins with “STA_” contain condensed overview information about the status and configuration of the system. Some objects hold ALERT and ALERT_REASON columns that indicate whether there is an immediate need for action. The information is prepared for usage in external monitoring tools or direct user queries. The alert levels and their meaning are:
0…OK
1…Warning
2…Error
Furthermore the ALERT_REASON column might show a textual description, if a warning or an error occured.
Views starting with “STA_” are always granted to public, while all other views and tables are only granted to the application manager.
8.2.1. Object Status (REDADM)
see Object Status
8.2.2. TSA-Loader Status (REDADM)
The related views in REDADM show status information of all TSA-connectors in the system, i.e. DBI, CFI and custom connectors.
STA_TSA_QUEUED_LOADER: Shows the status of all TSA-loaders which are currently queued for execution (status: NOT SCHEDULED).
STA_TSA_ACTIVE_LOADER: Shows the status of all TSA-loaders which are currently in status SCHEDULED, RUNNING or FAILED. The column RUNTIME shows the actual runtime in seconds while RUNTIME_AVG shows the average runtime of this loader and RUNTIME_STDDEV shows the corresponding standard deviation of the sample.
The ALERT column switches to 1 if:
the loader has been more than 30s in status SCHEDULED
the RUNTIME > RUNTIME_AVG + 3 x RUNTIME_STDDEV (3-sigma rule)
The ALERT column switches to 2 if:
the loader has been more than 60s in status SCHEDULED
the RUNTIME > RUNTIME_AVG + 4 x RUNTIME_STDDEV (4-sigma rule)
STA_TSA_LOADER_COUNT: Gives an overview (total count) of all not scheduled, scheduled, running and failed TSA loaders in the framework.
8.2.3. PSA-Loader Status (REDADM)
The related views in REDADM show status information of currently active PSA-loader processes.
STA_PSA_QUEUED_LOADER: Shows the status of all PSA-loaders which are currently queued for execution (status: NOT SCHEDULED).
STA_PSA_ACTIVE_LOADER: Shows the status of all PSA-loaders which are currently in status SCHEDULED, RUNNING or FAILED. The column RUNTIME shows the actual runtime in seconds while RUNTIME_AVG shows the average runtime of this loader and RUNTIME_STDDEV shows the corresponding standard deviation of the sample.
The ALERT column switches to 1 if:
the loader has been more than 30s in status SCHEDULED
the RUNTIME > RUNTIME_AVG + 3 x RUNTIME_STDDEV (3-sigma rule)
The ALERT column switches to 2 if:
the loader has been more than 60s in status SCHEDULED
the RUNTIME > RUNTIME_AVG + 4 x RUNTIME_STDDEV (4-sigma rule)
STA_PSA_LOADER_COUNT: Gives an overview (total count) of all not scheduled, scheduled, running and failed PSA loaders in the framework.
STA_PSA_CONTROL_DETAIL: Shows the full history of each and every PSA loader process.
8.2.4. Application Status (REDADM)
STA_APP_OBJECT_STATUS: Shows the object status of all components of an application. The OBJECT_STATUS takes its values from STA_OBJECT_STATUS and LAST_CHANGE is taken from LAST_PSA_FINISH. Alert values are based on STA_OBJECT_STATUS as well. Note that this view ignores all loads which are not planned by a corresponding load cycle since they not relevant for an application status.
STA_APP_STATUS: Applications
RED_APP_ACT_STATUS: Shows the status application actions for each BDate (information about the last run only).
RED_APP_ACT_CONTROL_DETAIL: Shows detailed information of each action run (full history).
8.2.5. Connector Logs
For detailed log information regarding the data import from source to TSA check out the views CFIADM.CFI_IMPLOG_DETAILS and DBIADM.DBI_CDC_LOG_DETAILS, respectively. An aggregated status can be found in DBIADM.DBI_CDC_STATUS and CFIADM.CFI_IMP_STATUS, respectively.
8.3. REDINFO
redinfo is a commandline tool which gives a (constantly refreshing) overview of the RED framework including watchers, jobs and active loaders as well as of the general status of the DB. It may be used for interactive monitoring.